Configuring Metrics
A fully configured, production-scale zrok service instance looks like this:
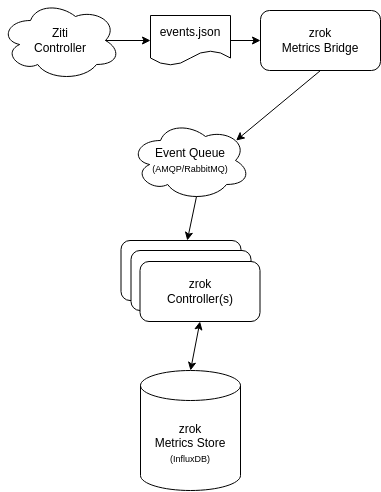
zrok metrics builds on top of the fabric.usage event type from OpenZiti. The OpenZiti controller has a number of way to emit events. The zrok controller has several ways to consume fabric.usage events. Smaller installations could be configured in these ways:
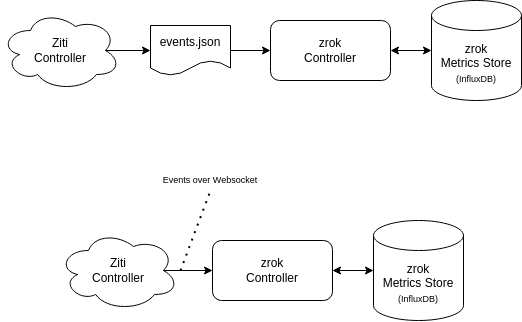
Environments that horizontally scale the zrok control plane with multiple controllers should use an AMQP-based queue to "fan out" the metrics workload across the entire control plane. Simpler installations that use a single zrok controller can collect fabric.usage events from the OpenZiti controller by "tailing" the events log file, or collecting them from the OpenZiti controller's websocket implementation.
Configuring the OpenZiti Controller
This requires a version of OpenZiti with a
fabricdependency ofv0.22.52or newer, which is satisfed by thev0.27.6release of OpenZiti Controller.
Emitting fabric.usage events to a file is currently the most reliable mechanism to capture usage events into zrok. We're going to configure the OpenZiti controller to append fabric.usage events to a file, by adding this stanza to the OpenZiti controller configuration:
events:
  jsonLogger:
    subscriptions:
      - type: fabric.usage
        version: 3
    handler:
      type: file
      format: json
      path: /tmp/fabric-usage.json
You'll want to adjust the events/jsonLogger/handler/path to wherever you would like to send these events for ingestion into zrok. There are additional OpenZiti options that control file rotation. Be sure to consult the OpenZiti docs to tune these settings to be appropriate for your environment.
By default, the OpenZiti events infrastructure reports and batches events in 1 minute buckets. 1 minute is too large of an interval to provide a snappy zrok metrics experience. So, let's increase the frequency to every 5 seconds. Add this to the network stanza of your OpenZiti controller's configuration:
network:
  intervalAgeThreshold: 5s
  metricsReportInterval: 5s
And you'll want to add this stanza to the tail-end of the router configuration for every router on your OpenZiti network:
metrics:
  reportInterval: 5s
  intervalAgeThreshold: 5s
Be sure to restart all of the components of your OpenZiti network after making these configuration changes.
Configuring the zrok Metrics Bridge
zrok currently uses a "metrics bridge" component (running as a separate process) to consume the fabric.usage events from the OpenZiti controller, and publish them onto an AMQP queue. Add a stanza like the following to your zrok controller configuration:
bridge:
  source:
    type:           fileSource
    path:           /tmp/fabric-usage.json
  sink:
    type:           amqpSink
    url:            amqp://guest:guest@localhost:5672
    queue_name:     events
This configuration consumes the fabric.usage events from the file we previously specified in our OpenZiti controller configuration, and publishes them onto an AMQP queue.
RabbitMQ
For this example, we're going to use RabbitMQ as our AMQP implementation. The stock, default RabbitMQ configuration, launched as a docker container will work just fine:
$ docker run -it --rm --name rabbitmq -p 5672:5672 -p 15672:15672 rabbitmq:3.11-management
Once RabbitMQ is running, you can start the zrok metrics bridge by pointing it at your zrok controller configuration, like this:
$ zrok ctrl metrics bridge <path/to/zrok-controller.yaml>
Configuring zrok Metrics
Configure the metrics section of your zrok controller. Here is an example:
metrics:
  agent:
    source:
      type:         amqpSource
      url:          amqp://guest:guest@localhost:5672
      queue_name:   events
  influx:
    url:            "http://127.0.0.1:8086"
    bucket:         zrok  # the bucket and org must be
    org:            zrok  # created in advance in InfluxDB
    token:          "<secret token>"
This configures the zrok controller to consume usage events from the AMQP queue, and configures the InfluxDB metrics store. The InfluxDB organization and bucket must be created in advance. The zrok controller will not create these for you.
Testing Metrics
With all of the components configured and running, either use zrok test loop or manually create share(s) to generate traffic on the zrok instance. If everything is working correctly, you should see log messages from the controller like the following, which indicate that that the controller is processing OpenZiti usage events, and generating zrok metrics:
[5339.658]    INFO zrok/controller/metrics.(*influxWriter).Handle: share: 736z80mr4syu, circuit: Ad1V-6y48 backend {rx: 4.5 kB, tx: 4.6 kB} frontend {rx: 4.6 kB, tx: 4.5 kB}
[5349.652]    INFO zrok/controller/metrics.(*influxWriter).Handle: share: 736z80mr4syu, circuit: Ad1V-6y48 backend {rx: 2.5 kB, tx: 2.6 kB} frontend {rx: 2.6 kB, tx: 2.5 kB}
[5354.657]    INFO zrok/controller/metrics.(*influxWriter).Handle: share: 5a4u7lqxb7pa, circuit: iG1--6H4S backend {rx: 13.2 kB, tx: 13.3 kB} frontend {rx: 13.3 kB, tx: 13.2 kB}
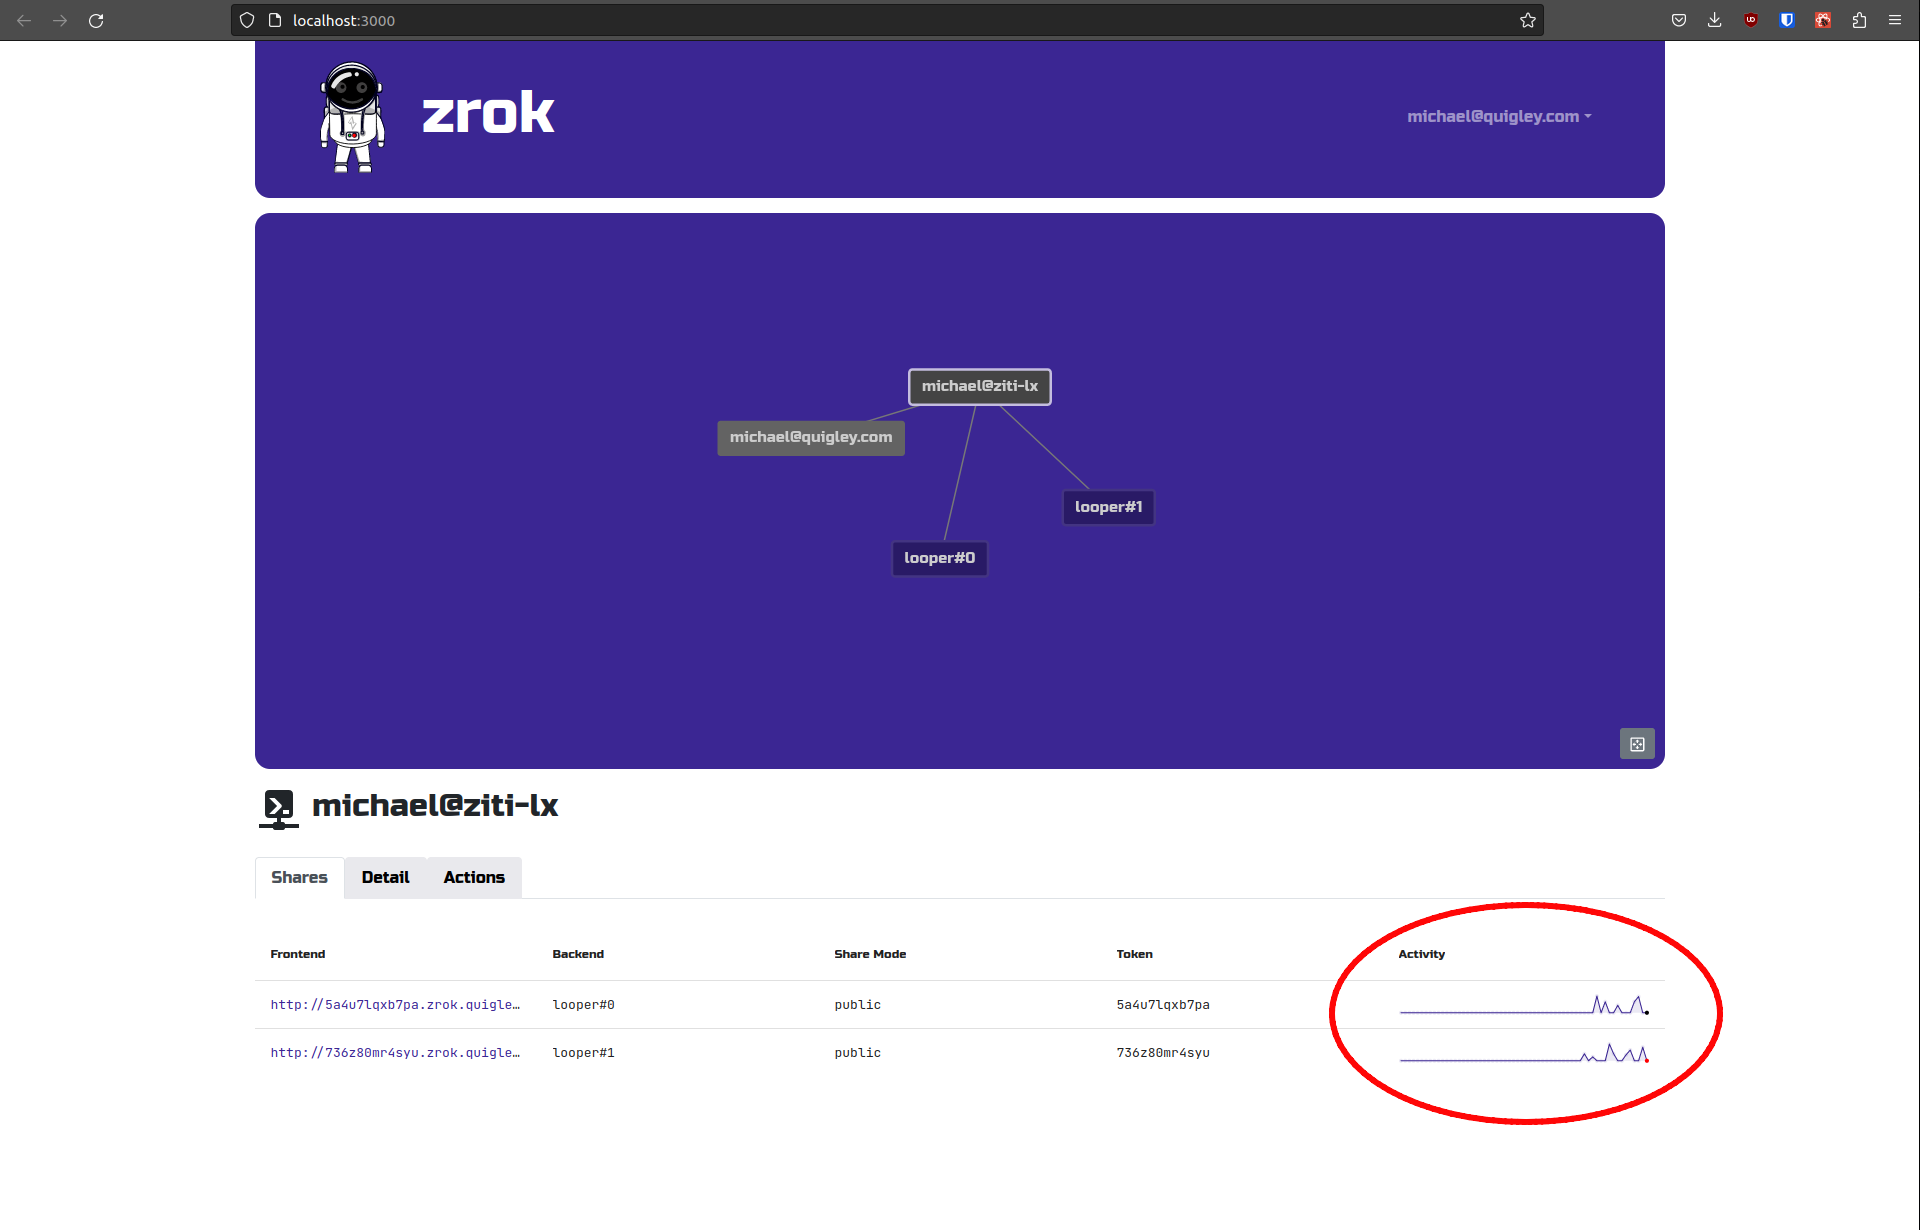
The zrok web console should also be showing activity for your share(s) like the following:
With metrics configured, you might be interested in configuring limits.